Tesco Search Reporter
Data Visualisation

May 2016
Role - Senior Designer
Client - Tesco
Agency - Head London
Frontend Developer - Jolyon Russ
Backend Developer - Ciaran McGhie
Product Owner - Emma Cosh
To help Tesco better understand what customers search for on their website, Head built a basic prototype which visualised in real time, the top 25 successful and unsuccessful searches on the grocery section of tesco.com. The aim was also to demonstrate to stakeholders the potential in visualising data in a visual and more appealing way. The visualisation was intended for display in the Tesco offices and lobbies, and also aimed to connect staff to customer needs. The prototype was well received and the next step was to create a more visually appealing solution as well as look at what other data would be interesting to visualise.

Head's basic prototype
Research & Process
I started by researching different types of information visualisation, adding references I found to a Pinterest board. An InVision board was handy to quickly create a moodboard which I used to present various approaches and ideas to the team. This created a good foundation for deciding what type of visualisation made sense. Initially we thought about using D3.js, but as there was no interactivity and the data was not that complex, the React javascript library was used instead. I sketched some basic ideas based on the data I knew we were getting:
- the number of total searches on a search term
- the time when it occurred
- we later added rank - whether the number of searches had increased or decreased over time
A limitation was that only 25 search terms could be displayed at any given time. We needed to define what useful parameters we could visualise and create something useful and interesting to look at. The intended result was something organic, that felt like it was calmly breathing. Another requirement was that it work with data other than search terms.

Concept Fan / Sunburst

Bubble Clusters / Comparison

Bubble Mind Map
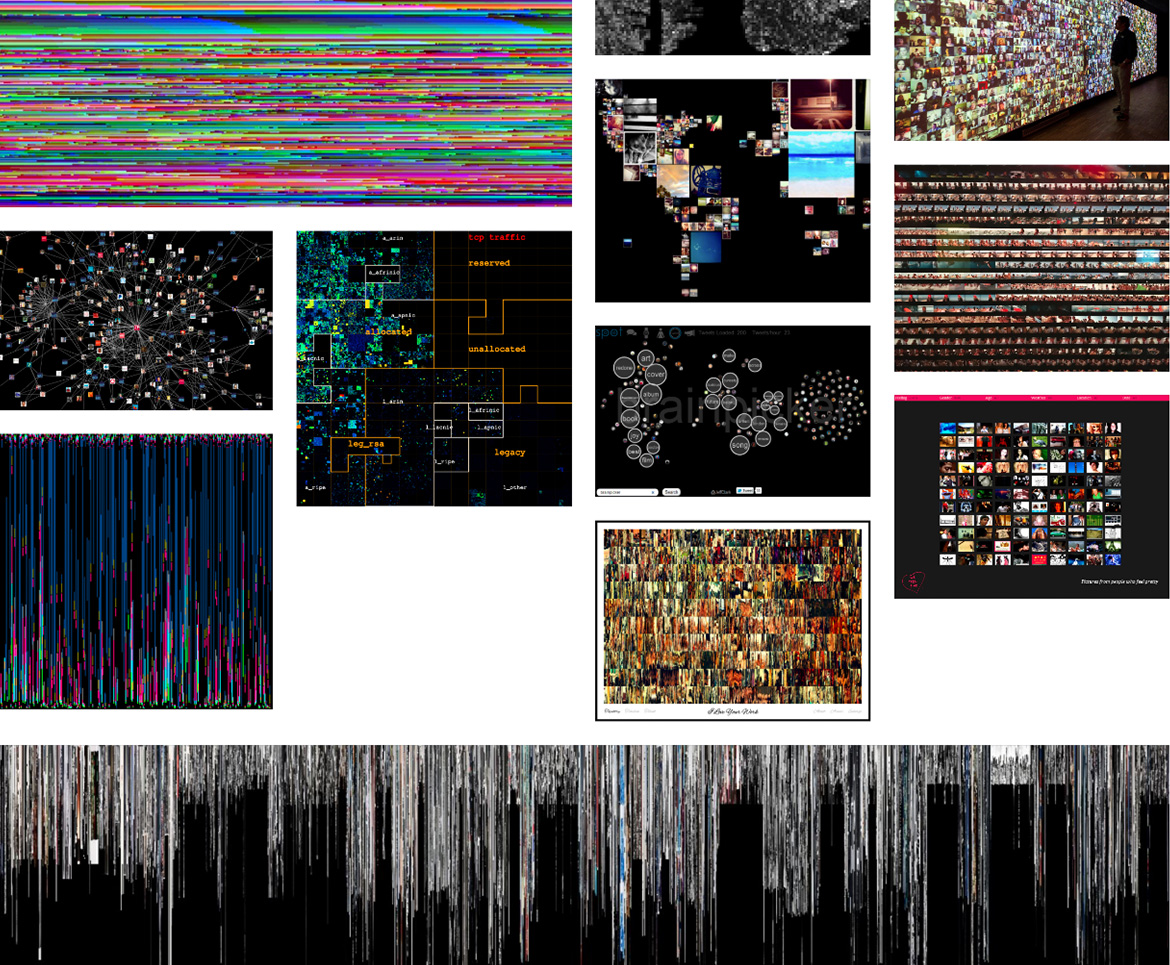
Image Driven
Vibrant Colour
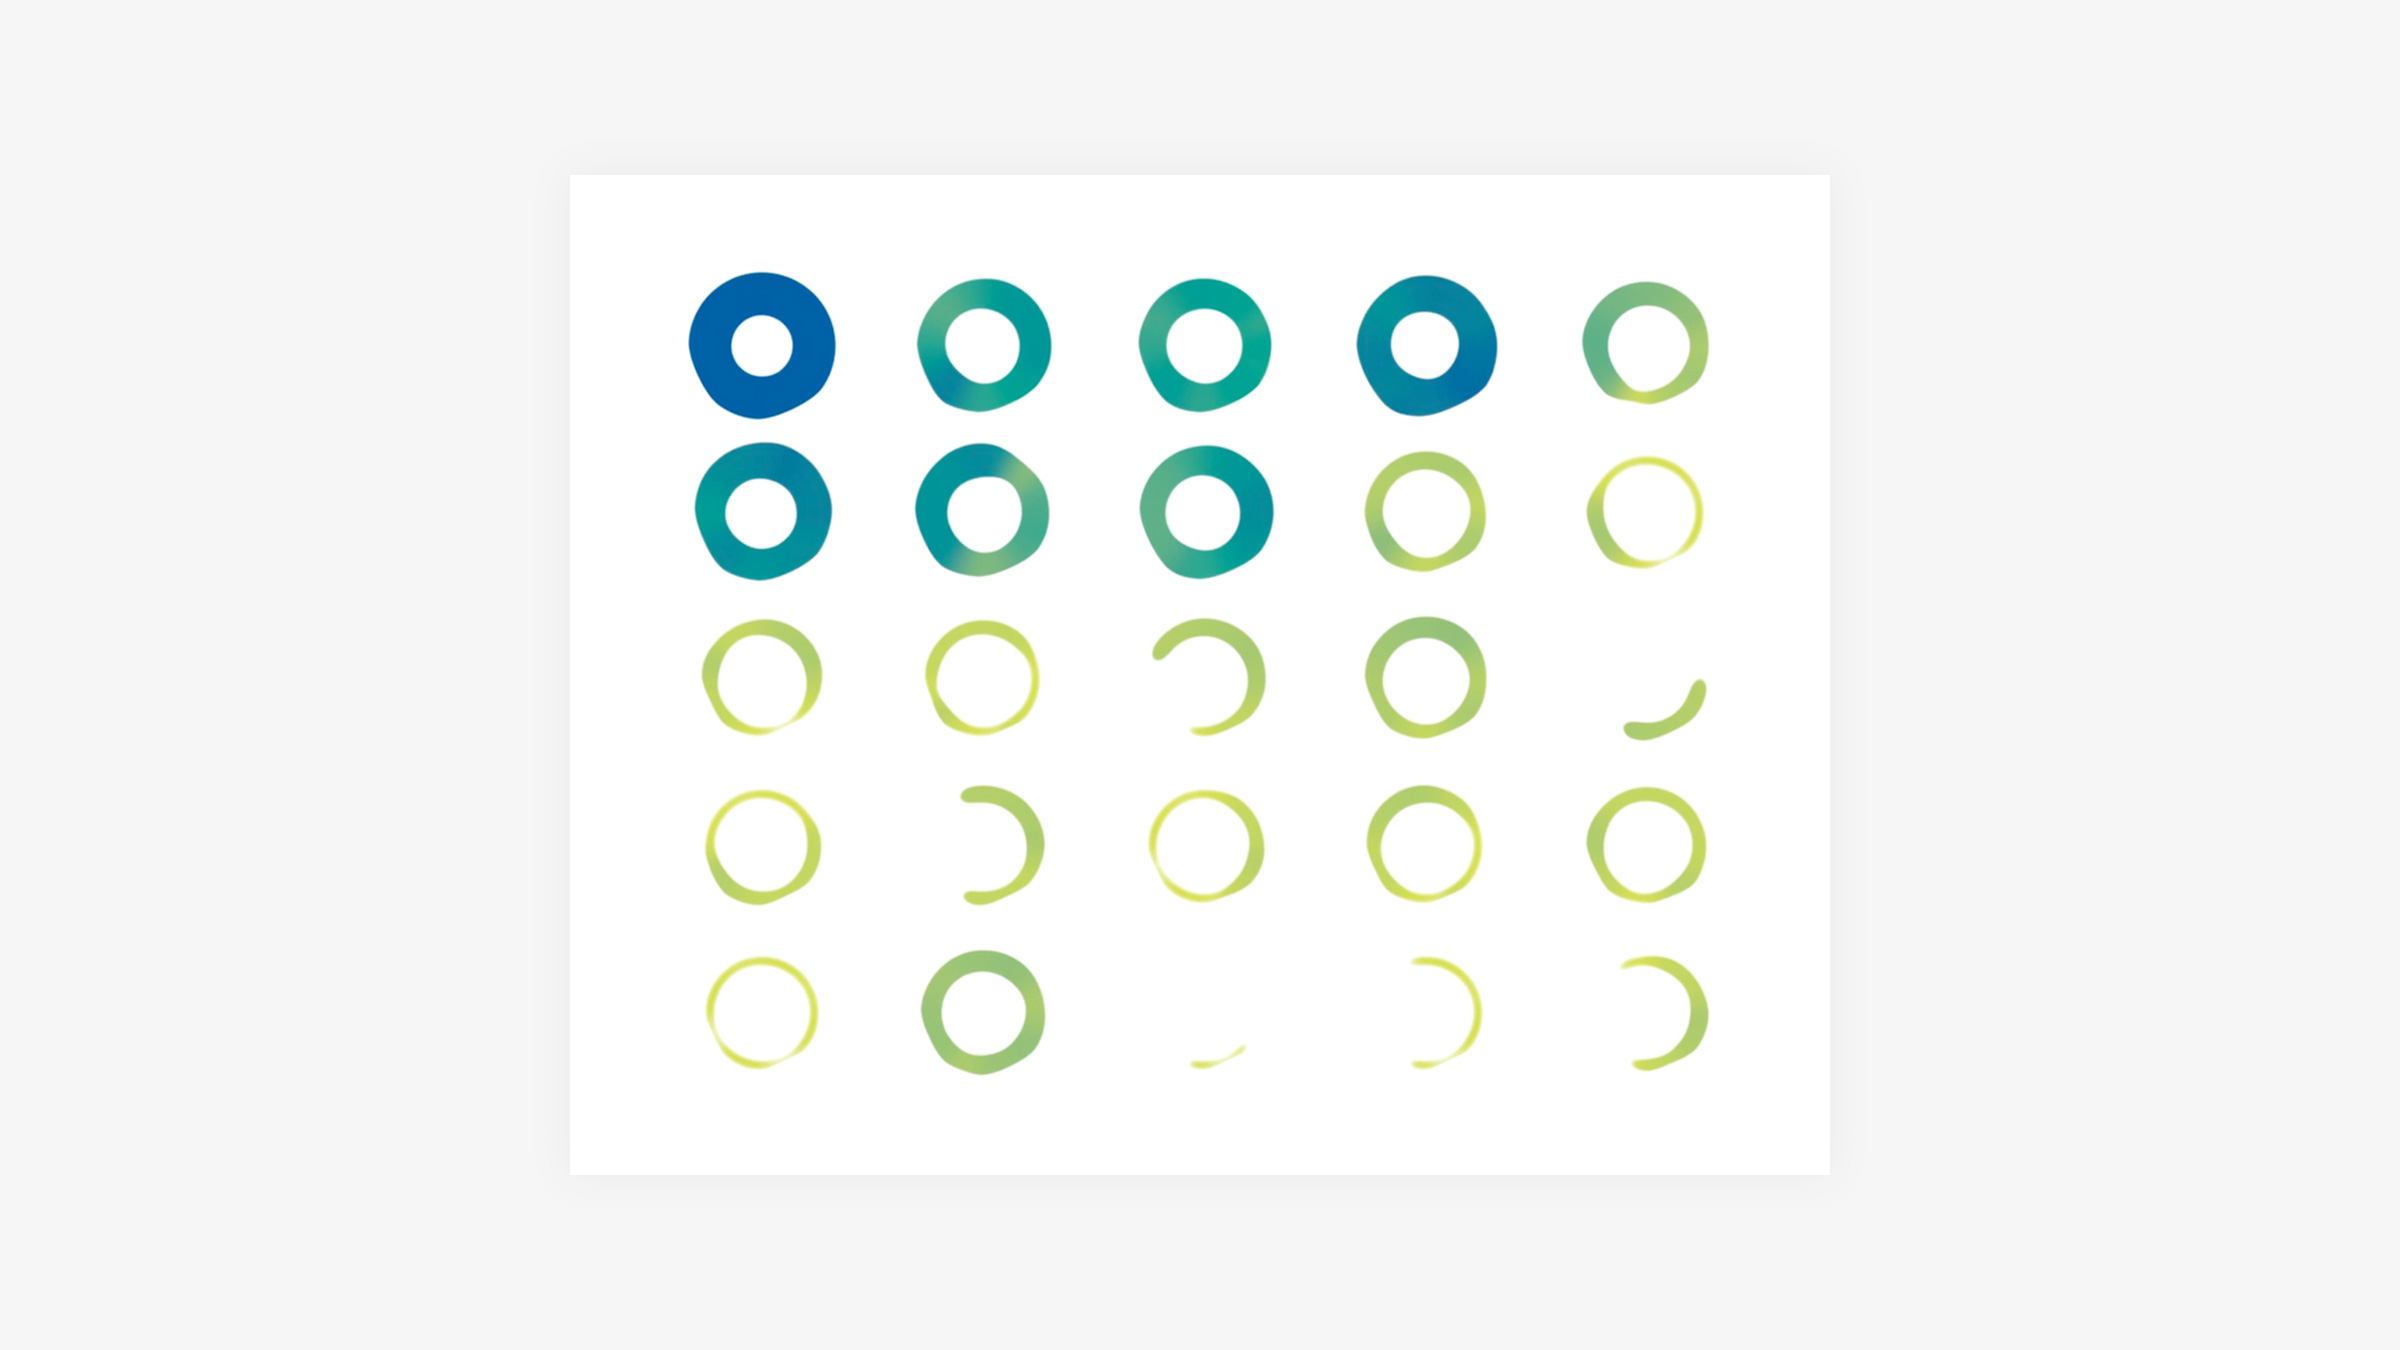
The Tesco style guide defines blue as a positive colour, and red as a negative colour. I selected some colours from the Tesco data colour palette to generate the colours for the successful and null searches respectively.
To create the seven gradient swatches I used a Lch and Lab colour and gradient picker. I found the that using the Lch colour space resulted in brighter colours and less muddiness between the colour values.

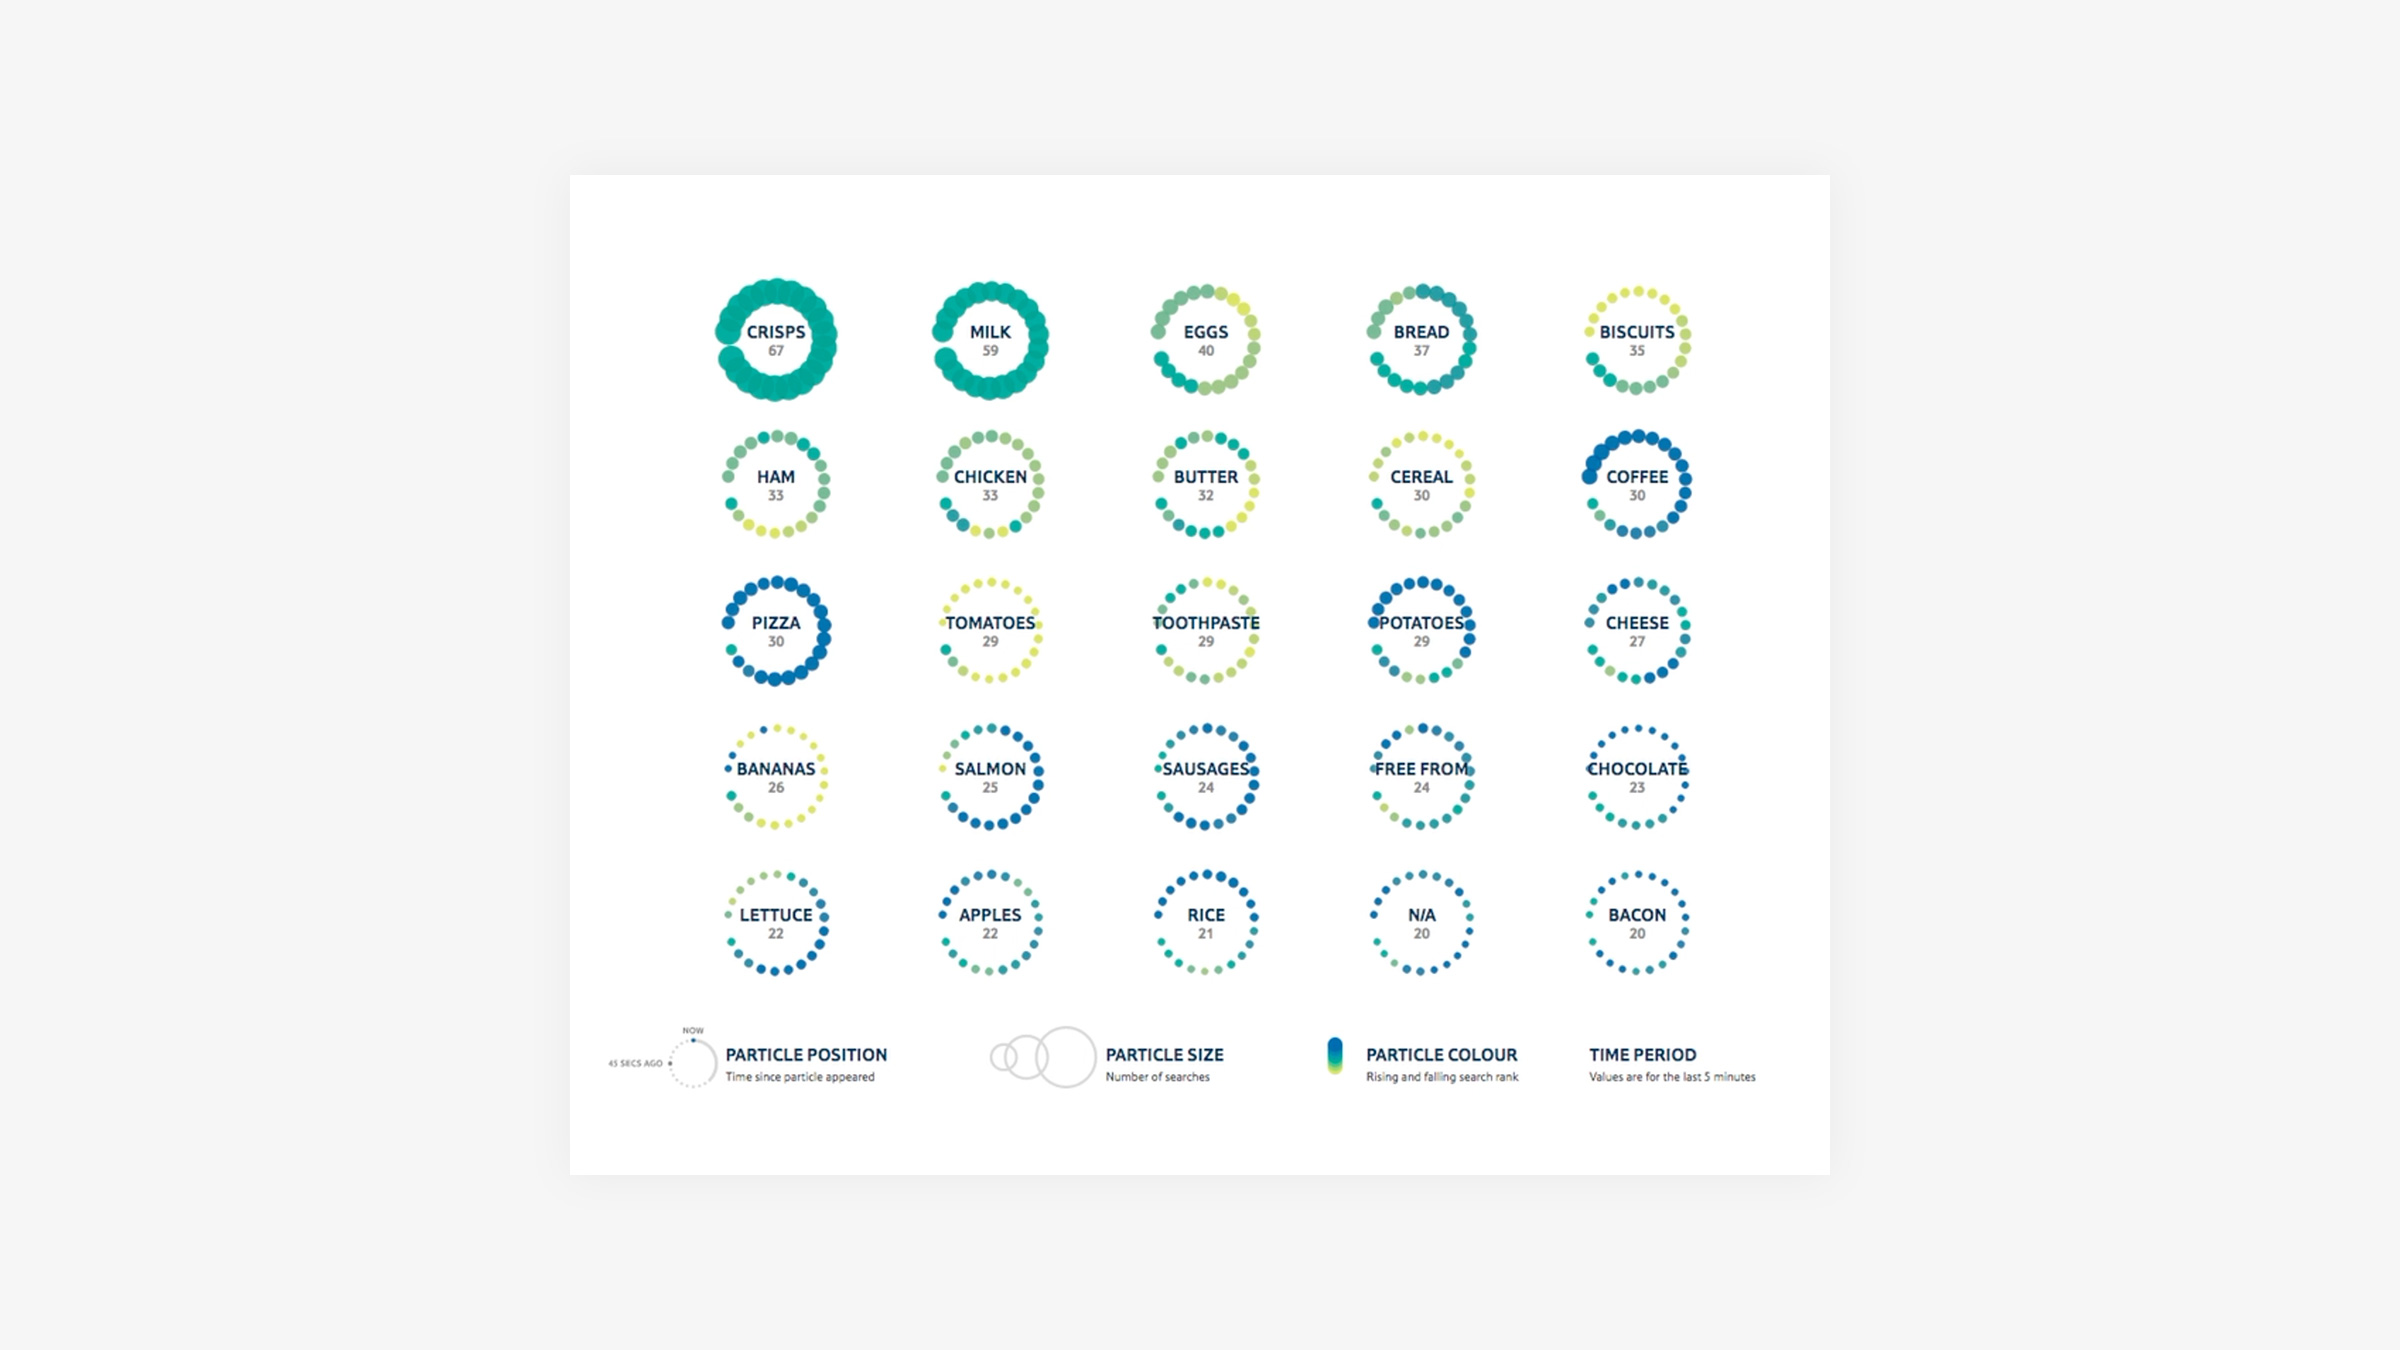
Key
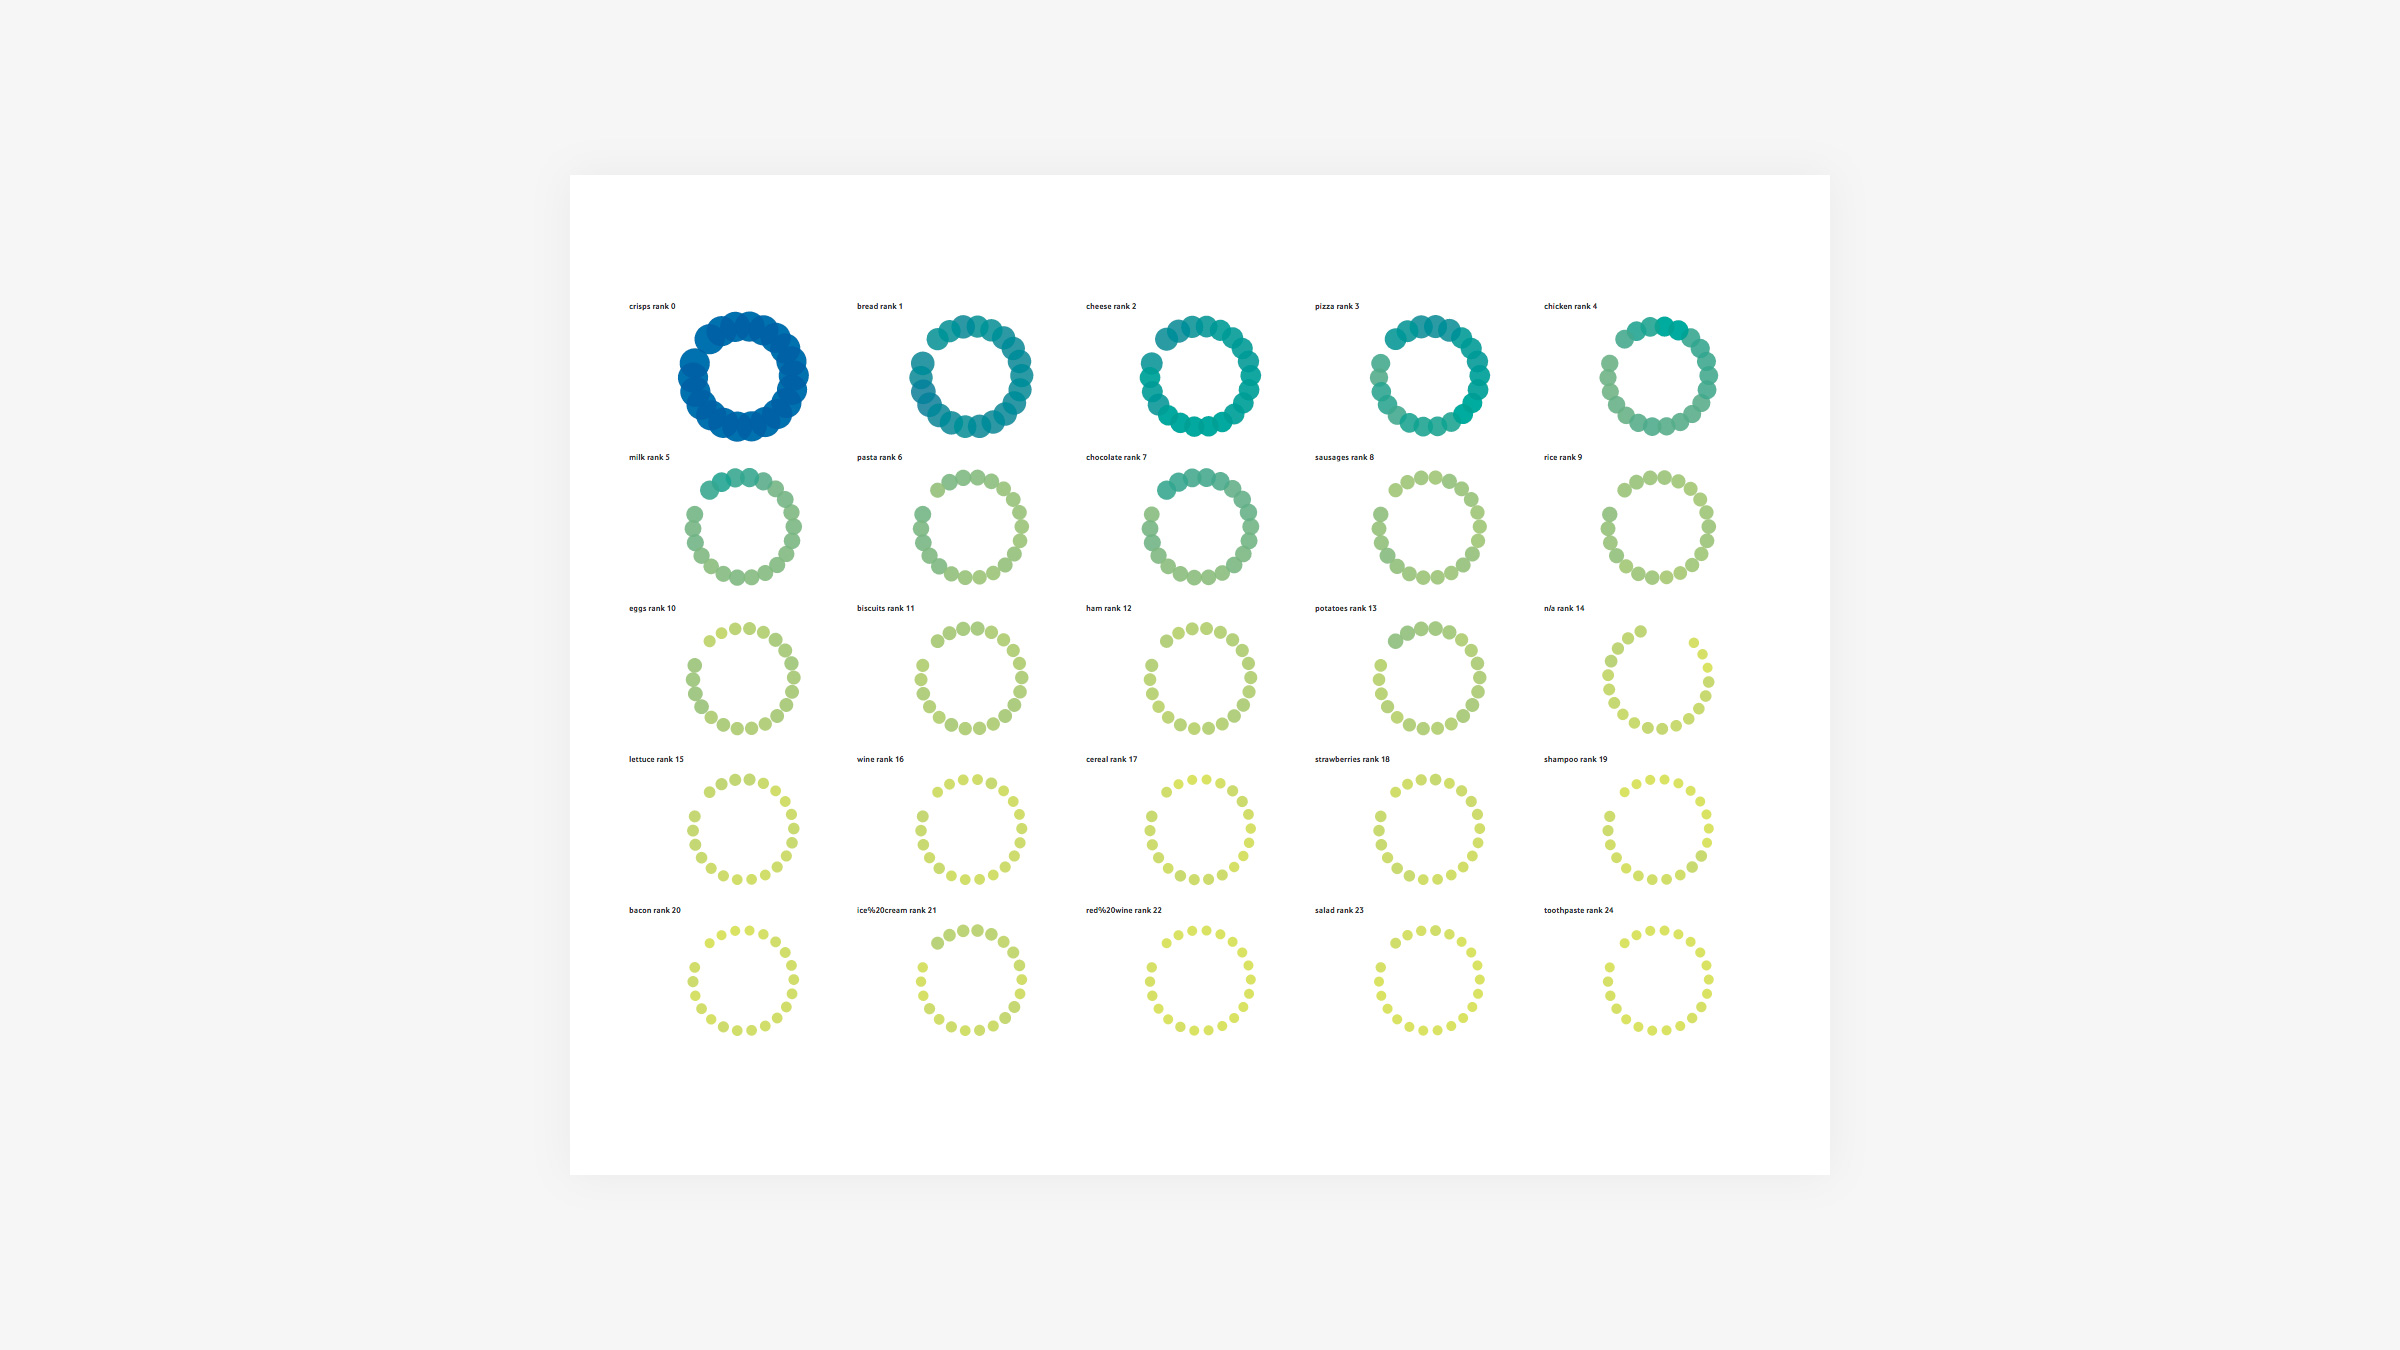
We established the following parameters:
- the overall size of each ring represents the number of total searches done on a search term
- the particle position around the ring equals the time since the particle appeared
- the particle colour represents a rising or falling search rank

Design
I decided to use Processing and Joshua Davis’ Hype framework to output some examples of how the particles could look when clustered or positioned around an ellipse. The processing results were inaccurate as it wasn’t using real data, but they helped form the basis for a visual direction. Front end exploration had started in parallel to design and I was yet to understand exactly how the data would come down.
Processing Hype Exports
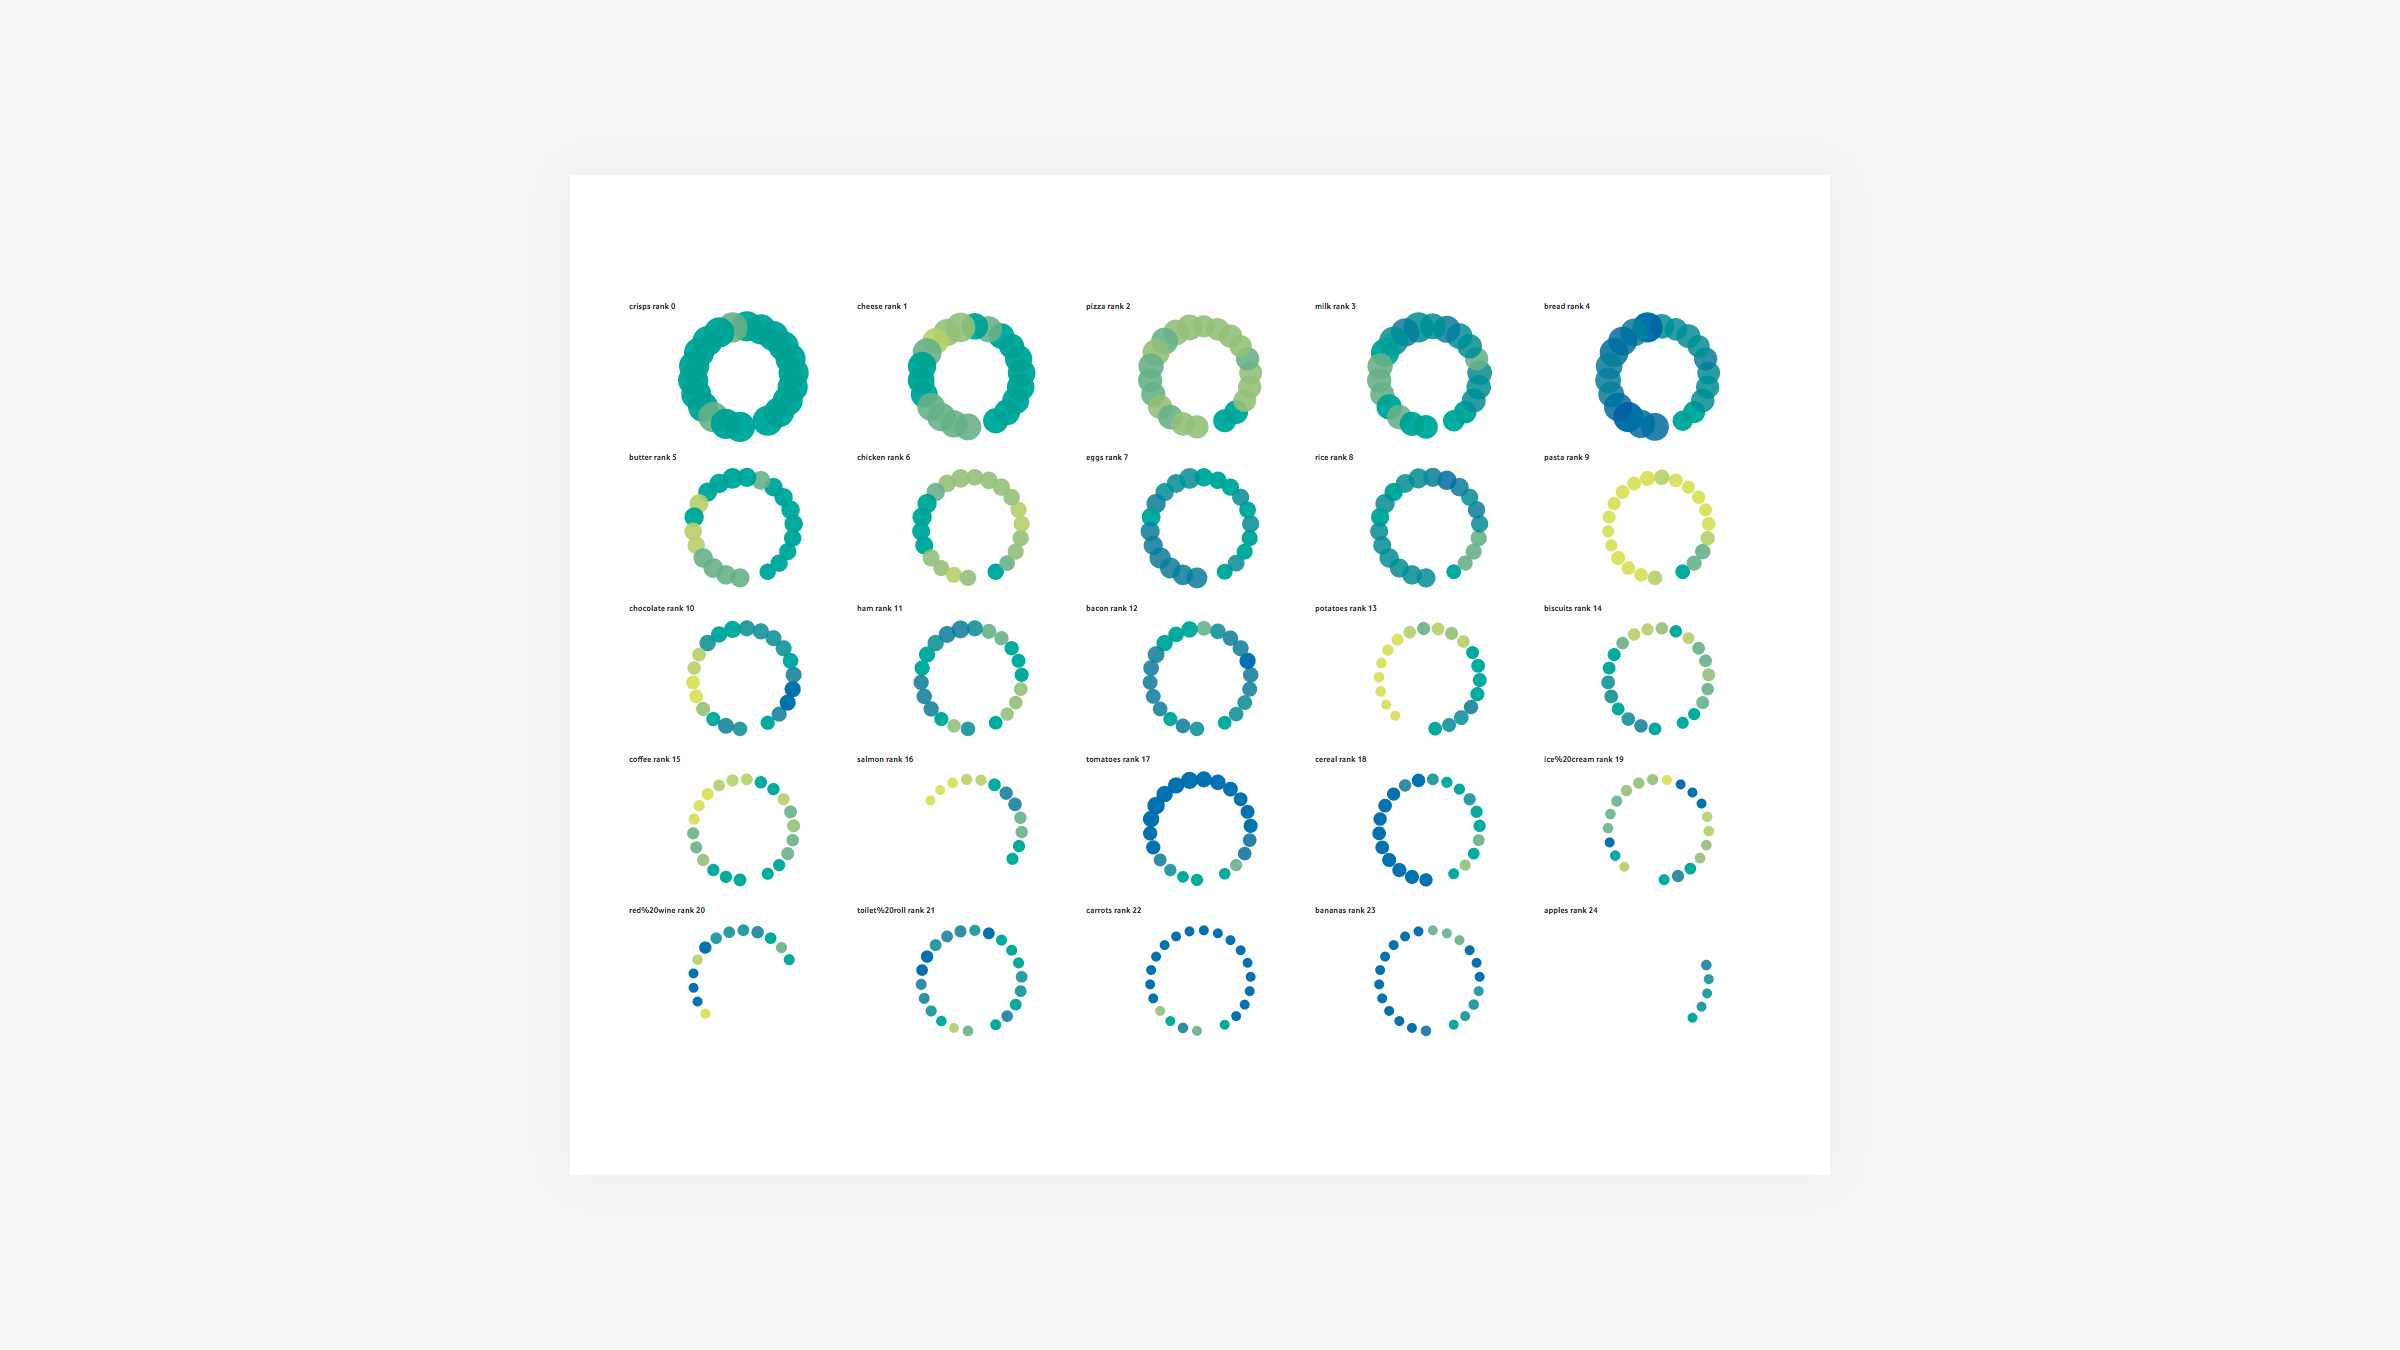
The overall circle size was a useful way to immediately show the most searched search terms, and easily integrated with the search term and search count that was associated with it. Plotting the 25 search terms on a grid was a scalable solution and helped use screen real estate since we were not working with a very big data set.


Once the parameters were applied it was clear that the visualisation was quite different to the earlier design exploration, due to how often the api would make calls to collect the search data and how far back in time it looked.
Seeing it in action, the following was clear:
- there was a lot less variation in size of each “ring”
- there was a lot less variation in size and less particles around each ring (as the number of searches per search term did not fluctuate that greatly over a shorter time span)
Output
This was an evolved proof of concept created over one two week sprint, with the aim of further development. It was well received by the product owner and fulfilled the basic requirements. I look forward to hearing how employees and stakeholders reacted to the project.